
Research Background
This study elucidates the dynamics of riverine nutrient fluxes and their pathways within a coupled human-hydrological-biogeochemical framework by examining a typical urban agglomeration during a period of rapid socioeconomic development. The following conclusions can be drawn from the analysis:
- Nutrient dynamics of NPS are proportional to the coupling of transport processes and nutrient inputs. Surface flow is particularly high in urban and agricultural areas, making agricultural land an active NPS zone due to the intensive fertilizer use, while urban areas serve as hotspots for surface nitrogen transport from nitrogen deposition. High nitrogen levels in forested regions result from soil nitrate pool in the lateral layer, where lateral flow is not a limiting factor.
- PS variations are primarily driven by domestic sources, which initially surged and subsequently declined following significant advancements in wastewater treatment. Domestic sources establish a core-periphery pollution structure, where intensity decreases from domestic-heavy and hybrid-sourced areas at the core to agro-centric regions at the periphery. However, this structure weakens as domestic sources decline significantly while non-domestic sources remain dynamically balanced.
Results
Long-term variation in source composition
Riverine nutrient fluxes in the PRD exhibited inverted U-shaped trajectories over the period 1990–2020 (Fig. 1). These trajectories are characterized by an initial increase, a peak in 2002, and a subsequent decline, with final levels returning to those observed in 1990. The eight sources of nutrient fluxes displayed varying temporal patterns. The urban domestic source consistently represented the largest contributor. In contrast, the rural domestic source steadily declined. Industrial wastewater, despite continuing to increase, contributed the smallest share of nutrients. The breeding industry, encompassing livestock farming and aquaculture, showed contrasting trends that collectively resulted in a slight increase in nutrient fluxes.
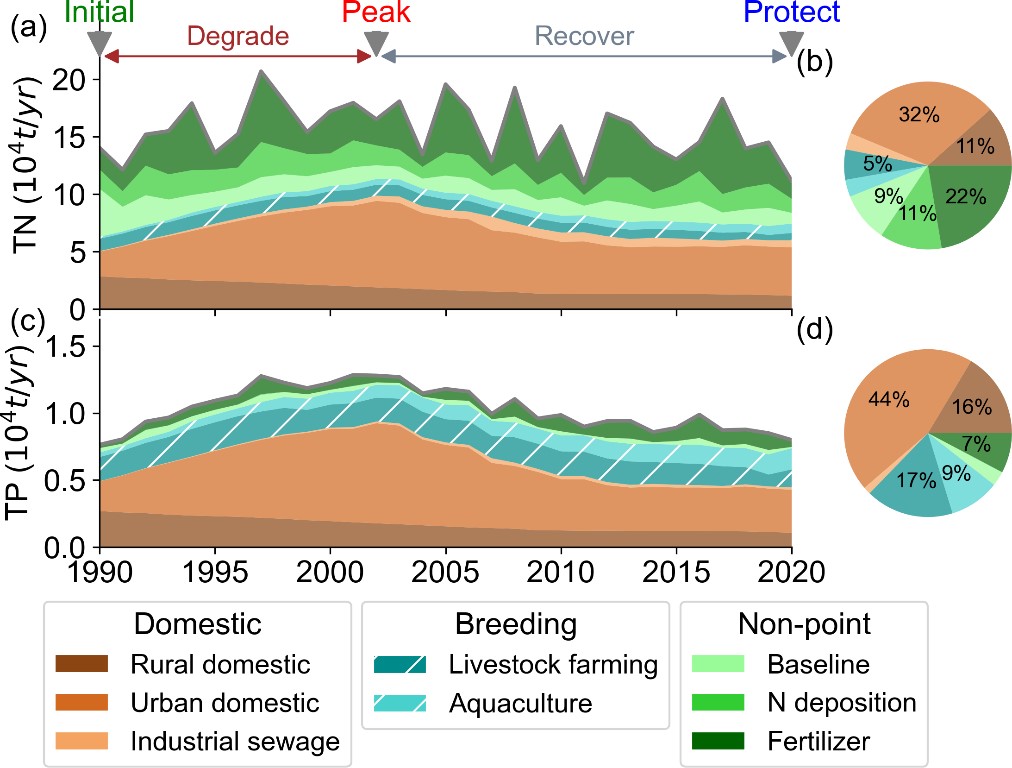
Figure 1. Temporal dynamics of nutrient fluxes from various sources, along with pie charts for (a, b) total nitrogen (TN) and (c, d) total phosphorus (TP).
Spatially core-periphery structure
Riverine nitrogen and phosphorus intensities among cities exhibited a strong correlation (r = 0.97), and the proportion of domestic sources also positively correlated with these intensities (r = 0.94) (Fig. 2). This spatial pattern supports a statistically significant core–periphery structure, with intensity decreasing from domestic-heavy to hybrid-sourced and agro-centric city groups, extending from the eastern bank to the western bank and peripheral regions. Specifically, Shenzhen and Dongguan were classified as domestic-heavy cities. These cities exhibited the highest nutrient intensities and had the highest proportions of domestic sources. In contrast, Jiangmen, Zhaoqing, and Huizhou, were classified as agro-centric cities. These cities had the lowest nutrient intensity levels, which were predominantly influenced by non-domestic pollution. Guangzhou, Foshan, Zhongshan, and Zhuhai, were classified as hybrid-sourced cities. These cities exhibited intermediate levels of nutrient intensity and domestic source ratios and were characterized by the highest intensity of the non-domestic sources.
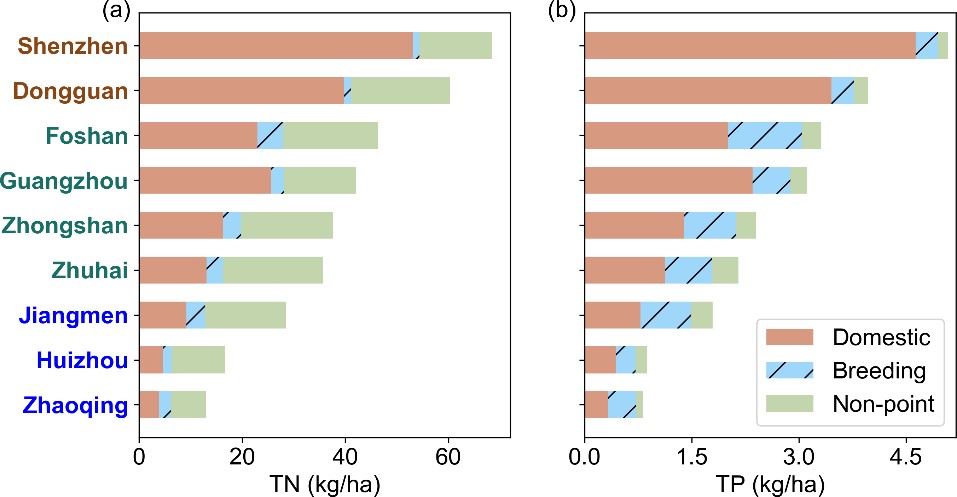
Figure 2. Annual nutrient intensity of (a) TN and (b) TP at the city level.
Land surface processes on NPS
We quantified the relationships between NPS categories and their controlling factors and compared nutrient intensity across different land uses (Fig. 3). Nutrient dynamics were proportional to the coupling of transport processes and nutrient inputs, with all r values being higher than 0.85. Surface flow played a dominant role in nutrient transport. Specifically, agricultural land exhibited the highest annual nutrient yield, as surface flow interacts with intensive fertilizer use. Surface flow also interacts with atmospheric deposition, which regulates nitrogen deposition sources in the surface layer. In addition, surface flow interacted with soil pools, which regulate baseline levels of surface nitrogen and phosphorus. The soil nitrogen pool played a key role in regulating both baseline and nitrogen deposition sources in the lateral layer, where lateral flow did not notably limit nutrient fluxes.
Riverine nutrient fluxes in the PRD exhibited inverted U-shaped trajectories over the period 1990–2020 (Fig. 1). These trajectories are characterized by an initial increase, a peak in 2002, and a subsequent decline, with final levels returning to those observed in 1990. The eight sources of nutrient fluxes displayed varying temporal patterns. The urban domestic source consistently represented the largest contributor. In contrast, the rural domestic source steadily declined. Industrial wastewater, despite continuing to increase, contributed the smallest share of nutrients. The breeding industry, encompassing livestock farming and aquaculture, showed contrasting trends that collectively resulted in a slight increase in nutrient fluxes.

Figure 3. Nutrient species controlled by the coupling of transport mediators and nutrient sources, including (a) nitrogen in the surface layer, (b) nitrogen in the lateral layer, and (c) phosphorus.
Human activities on PS
To understand the evolution of nutrients resulting from human activities, we analyzed the intensity of PS categories across three temporal stages of the U-shape curve in the city groups, and examined the contributions of a variety of factors during the two intervening periods (Fig. 4). The core-periphery pollution structure remained consistent throughout all stages. As urbanization progressed, urban domestic sources sharply increased due to rising water consumption during the degradation stage, followed by a decline resulting from improvements in wastewater treatment during the recovery stage. Rural domestic sources continuously decreased, initially due to a declining rural population and later due to improvements in rural wastewater treatment. The reduction in livestock farming was primarily attributed to a higher proportion of intensive farming practices, while the expansion of aquaculture was mainly linked to freshwater fish farming.
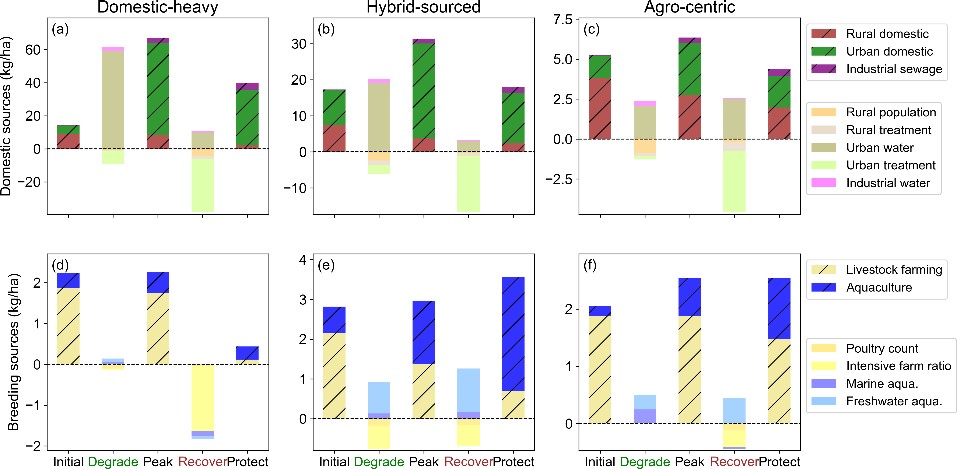
Figure 4. Annual nutrient intensity and factors impact on changes for TN (upper panels) and TP (lower panels) across city groups: (a, d) domestic-heavy cities, (b, e) hybrid-sourced cities, and (c, f) agro-centric cities.
For more detailed spatiotemporal feature analysis, please refer to: Zhang, Y., Gan, J., 2026. Variability of urban riverine nutrients under coupled human-hydrological-biogeochemical framework. J. Hydrol. 664, 134406. https://doi.org/10.1016/j.jhydrol.2025.134406.